R package ggfastman
This is a very fast and easy-to-individualize plotting function for GWAS results e.g. pvalues. Since I’m using ggplot2 a lot, I adopted the idea from a very nice project from boxiangliu and combined it with a super fast plotting approach from the scattermore project.
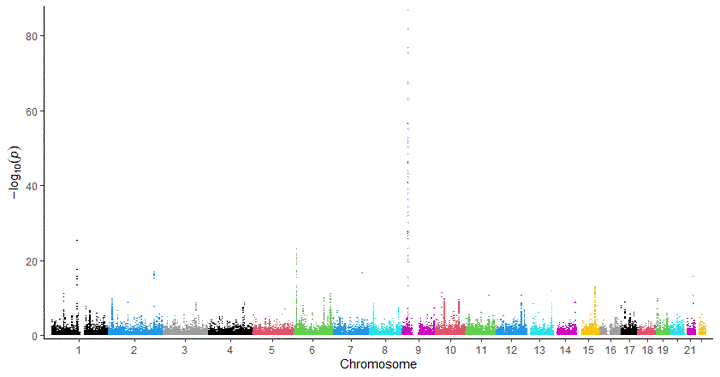
A manhattan plot displays pvalues chromosomal positions against -mostly -log10 values- of genome-wide association studies between single nucleotide variants (SNV) or polymorphisms (SNP) and an endpoint e.g. expression, enzyme activity or case-control data.
One of the first R packages offering manhattan as well as qq plots was qqman from Stephen Turner, and nowadays there are a lot of different packages and approaches available for R and python. But a very fast one, which is still fast when plotting billions of data points, is still missing.
This package ggfastman is trying to fill this gap.
Roman Tremmel
Scientist
My research interests include pharmacogenomics, bioinformatics and data analysis.